Monthly Labor Market Report: A break in the action

Key points

  • Instawork data suggested a steady labor market in March, possibly reflecting reduced churn at the macro level
  • Demand for concession, counter, and cashier shifts is ramping up with spring sports seasons
  • Last month men worked their highest share of shifts in 12 months
  • Fewer than 1 in 5 Instawork Pros hear about jobs from recruiters and staffing agencies

Every day, the Instawork platform handles thousands of transactions involving businesses and hourly professionals, generating a huge amount of data on hourly pay as well as other aspects of the labor market. This report summarizes some of the major trends in demographics, roles, and worker constraints in regions across the United States.

To receive future economic insights from the Instawork Economic Research Division, please subscribe by visiting: https://hubs.li/Q012kZ--0

The data are also compiled into the Instawork Pay Signal Index (PSI) and indexed trends in hourly pay. Because businesses can book shifts in advance on the Instawork platform, the metrics include forward-looking data for the current month as well. Please refer to the appendix for explanations of the methods behind each metric.

Starting this month, we are presenting reorganized, rebalanced, and re-indexed statistics with July 2022 as their base, for greater ease of use.

The labor market as a whole looked hotter in February, with increases in pay predominating and other indicators also showing signs of strength. In March we expect these factors to moderate slightly:

In-app survey data

Our in-app surveys track Pros' labor market situations on a monthly basis. For details on methods and questionnaires, please see the Methodological Appendix below.

Pros' ease of finding full-time and part-time jobs was relatively unchanged in March, but they had a much harder time finding app-based or temporary work outside of the Instawork platform:

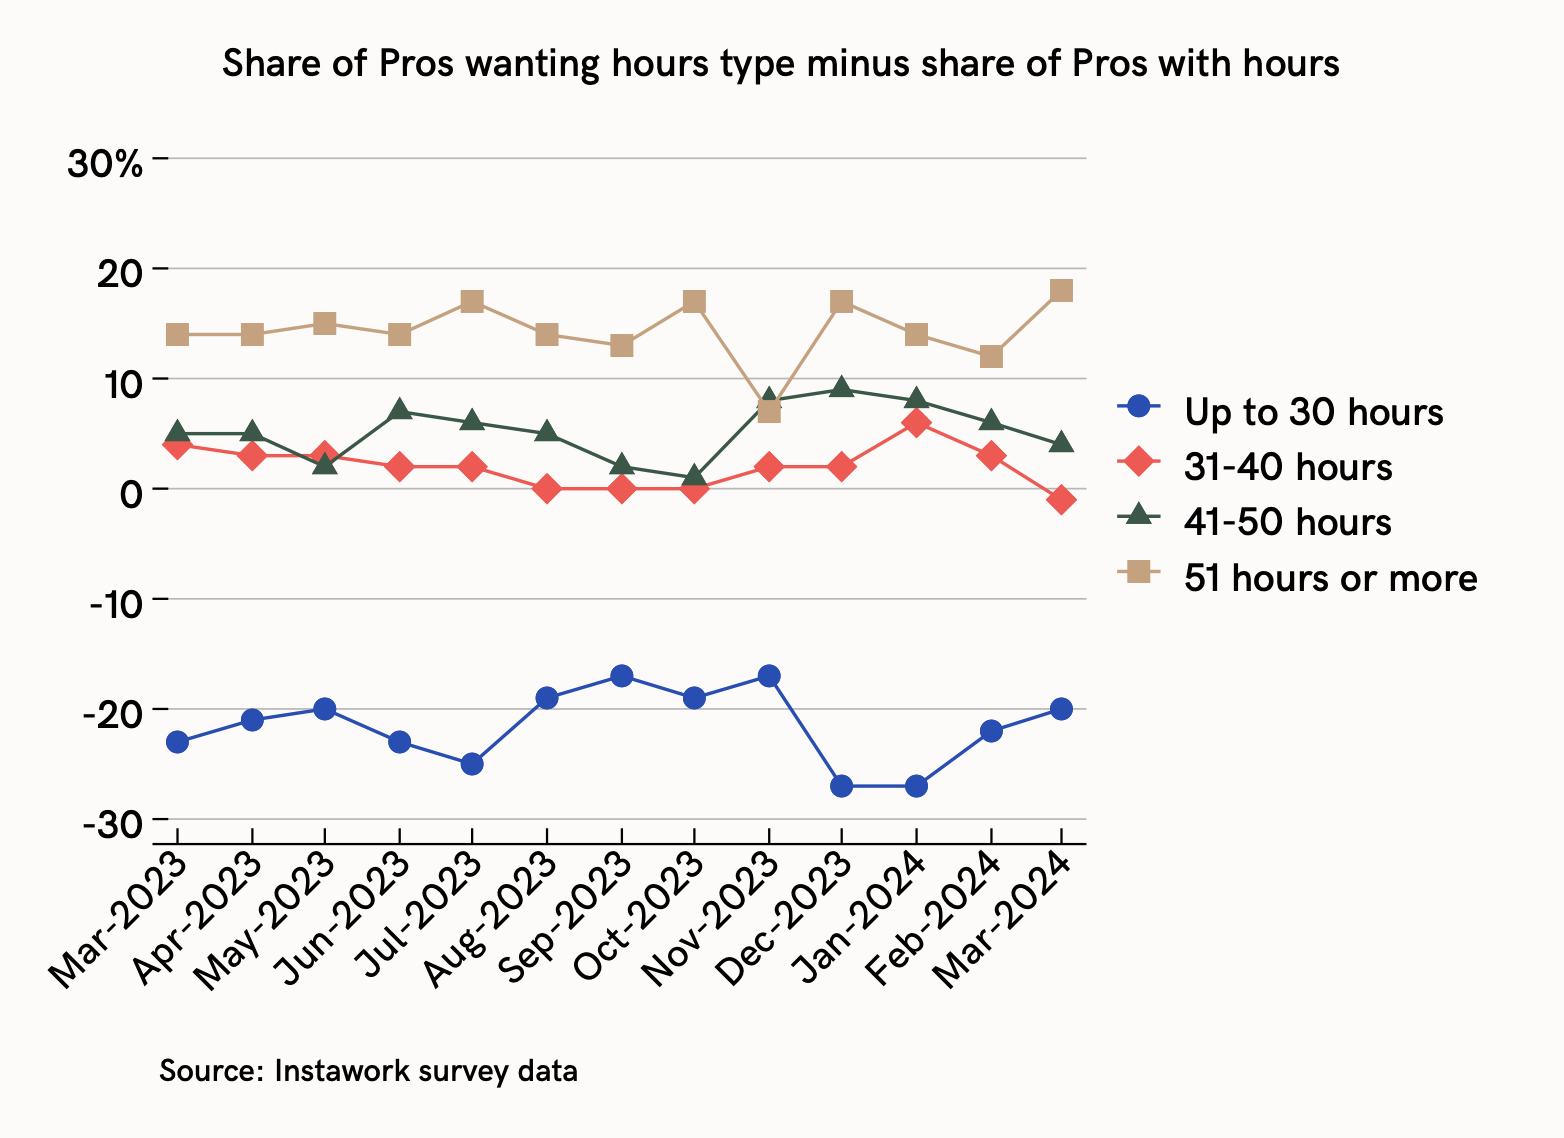
Yet for the second straight month, Pros who wanted to work essentially full-time hours (31 to 50 hours) had an easier time. Those who wanted more hours struggled:

This nascent trend may reflect the decreasing churn in the labor market as a whole, with more workers holding onto permanent positions while companies are less eager to hire and fire.

In March we also asked Pros how they found out about jobs. Fewer than 1 in 5 said they heard about jobs from recruiters and staffing businesses, suggesting that Pros do indeed represent a vast labor force for flexible work that goes largely untapped by traditional temp agencies:

Fewer than 2 in 5 used the biggest job sites online, another big contrast with workers who do "standing" rather than "sitting" jobs. These workers still have access to information about flexible work – including longer-term and temp-to-hire roles – via online platforms like Instawork, which they use at double the rate (at least for this rather special sample).

Recent growth in flexible work

Because flexible work is one of several options that workers might have in the labor market, increases in flexible work may mean decreases in other areas. The following statistics measure differences in shift work booked on the Instawork platform (measured in hours), month over month:

 Regions with the highest growth of flexible work  

 Regions with lowest growth of flexible work  

 1. Houston, TX

 1. San Antonio, TX

 2. New Orleans, LA

 2. Las Vegas, NV

 3. Phoenix, AZ

 3. Orlando, FL

 4. Pittsburgh, PA

 4. Indianapolis, IN

 Roles with the highest growth of flexible work  

 Roles with lowest growth of flexible work  

 1. Concession / Stand Worker

 1. Merchandiser

 2. Counter Staff / Cashier

 2. Brand Ambassador

 3. Event Setup and Takedown

 3. Barista

 4. Event Server

 4. Prep Cook

The onset of spring sports seasons has boosted demand for concession workers, counter staff, and cashiers. Demand for event staff continued grow strongly, while growth for retail roles like merchandiser and brand ambassador was weaker. Several metropolitan areas in the South also had heavy demand for flexible labor, though the trend did not extend across the entire region.

Technical note: To control for the growth of the Instawork platform, only business locations that have participated for at least two months before the start of the comparison period are included. Changes in hours are included only for roles for which businesses booked shifts during both months.

Demographics of flexible workers

In March more men worked shifts on the Instawork platform, and the share of Pros who identified as Black/African-American rose for the first time in four months:

This change has corresponded to a surge in sign-ups among Spanish speakers, who accounted for 8% of new Pros in February, the highest figure since May 2018.

Food service and hospitality

More businesses than expected ended up raising hourly pay for hospitality shifts in March, but advance bookings suggest a sharper drop in April. Leading the way will be bartenders and line cooks, for whom pay is expected to fall after peaking in March:

Front-of-house

Hourly pay rates for bartenders dropped in March as expected and may fall further in April, while pay for other front-of-house rolls will be relatively constant:

Back-of-house

After a small uptick in hourly pay for lines cooks, pay for back-of-house roles is again expected to be stable or slightly lower next month:

Custodial and cleaning

In one of the most volatile industry groups we track, businesses are again trying to push pay lower for maintenance roles. Pay for housekeepers may continue to be stable:

Manufacturing and production

Hourly pay for manufacturing shifts is expected to rebound in April after a preponderance of decreases in March, though pay for general labor shifts may be steady:

Retail and sales

With baseball returning and other arenas staffing up for the summer, average hourly pay is expected to decline after several months of gains driven by counter staff and cashiers:

Logistics and warehouse

Hourly pay in logistics is set for its third straight month with predominantly higher hourly pay after increases in pay for both entry-level and intermediate roles in March. Advance bookings suggest further increases may be small, however:

To receive future report briefings or data insights from our Economic Research team, please subscribe below.

Methodological appendix

Instawork in-app surveys

Five surveys per month are delivered via the Instawork Pro app. Random samples of Pros who have worked at least one shift in the past 12 months may be shown a one-question survey when they open the details for a shift. No Pro receives more than one survey per month. The surveys continue until they collect 1,000 responses.

The repeating questions on Pros' labor market situations are as follows:

1. Please mark all the kinds of work you will do this week:

  • regular full-time job
  • regular part-time job
  • shifts booked on Instawork
  • other app-based or temporary work
  • no work

2. Please mark all the kinds of work you would like to do each week:

  • regular full-time job
  • regular part-time job
  • shifts booked on Instawork
  • other app-based or temporary work
  • no work

3. In total, how many hours will you work this week at all your jobs?

  • 0-10
  • 11-20
  • 21-30
  • 31-40
  • 41-50
  • 51 or more

4. In total, how many hours would you like to work each week at all your jobs?

  • 0-10
  • 11-20
  • 21-30
  • 31-40
  • 41-50
  • 51 or more

Instawork PSI (Pay Signal Index)

The PSI gauges the overall direction of changes in hourly pay from month to month, much the way a purchasing managers’ index measures supply chain activity.

To begin, for each month, we measure the average hourly pay offered by each business on our platform for each role in each region. If the business offered shifts for the same role in the same region during the previous month, we record whether the average rose or fell. A rise is recorded as +1, a fall as -1, and no change as 0.

Next we weight this signal by the average number of shifts the business offered for that role across the two months. For example, if the business offered 10 shifts for line cooks in the Houston area during February and 18 shifts for the same role in the same region during March, then the weight would be 14.

We group these weighted signals by the Census Bureau’s occupational categories and take the weighted average for each category. Then we multiply the weighted average by 50 and add it to 50. This yields a PSI between 0 and 100. At 0, the PSI implies that all businesses in the sample offered lower pay. At a PSI of 100, all businesses offered higher pay. At a PSI of 50, businesses that raised or lowered pay did so with equal weight (or loosely, equal numbers of shifts).

At present we cover six major occupational categories. These are the numbers of workers they represented in the Bureau of Labor Statistics’ counts of hourly workers in 2023, and their shares of the total reported number of hourly workers:

 Occupational category

 Workers (1,000s)

 Share of hourly workers

 Transportation

 8,372

 10.4%

 Food preparation and serving  

 7,112

 8.8%

 Sales

 6,994

 8.7%

 Production

 6,583

 8.2%

 Building and grounds cleaning  

 3,673

 4.7%

To create a national PSI, we calculate a weighted average by weighting the PSI for each occupational category by its share of hourly workers above. The resulting national PSI represents occupational categories that cover roughly 41% of hourly workers in the American labor force.

Indexed trends in hourly pay

Sample selection for our pay trends is similar to the method for the PSI. Businesses that book shifts for the same role in the same region during consecutive months are the units of observation. For each pair of months, we calculate the change in the average hourly pay offered for the given role in the given region. Examples of roles are line cooks, forklift drivers, and custodial staff.

Next, as for the PSI, we weight the changes in pay by the average number of shifts across the two months. Then we calculate a weighted average of the changes at a national level for each role. To create an indexed trend, we have chosen July 2022 as the starting point, where the indexed hourly pay for each role is set to 100. We then use the monthly changes to map the trend from August 2022 onward.

At present we publish the indexed trends in hourly pay for 14 of the roles staffed on our platform:

 Indexed trends in hourly pay available for the following roles:

 Bartender

 General Labor

 Busser

 Housekeeper

 Concession or stand workers

 Line cook

 Counter staff or cashier

 Prep cook

 Custodial

 Runner

 Dishwasher

 Warehouse associate - entry level

 Event server

 Warehouse associate - intermediate